After the first 24 group-stage matches, the easiest question to ask is usually: who moved up or down in the title forecast?
That changed, but it was not where the biggest movement happened.
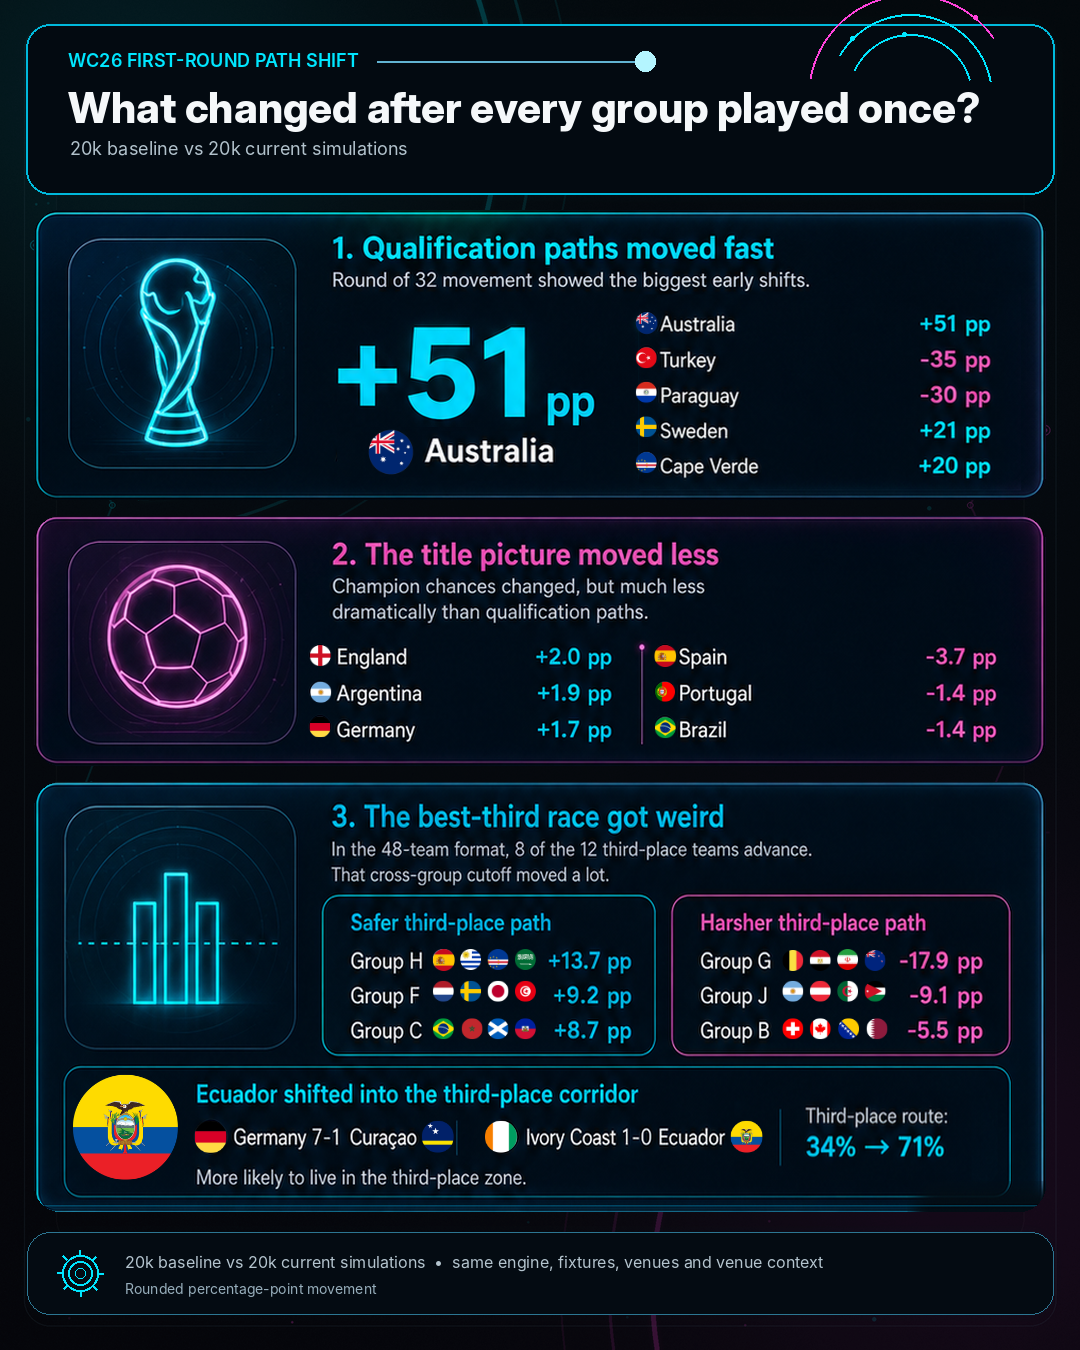
The opening round reshaped qualification routes much more aggressively than it reshaped the title picture. Some teams moved by 20, 30, or even 50 percentage points in their chance of reaching the Round of 32, while the biggest title-chance changes stayed in the low single digits.
The most unusual movement appeared in the best-third race. In the expanded 48-team format, eight of the twelve third-place teams advance, so qualification is no longer only about finishing in the top two. It is also about what kind of cross-group cutoff environment the tournament creates for third-place teams.
This comparison looks at how that picture changed after every team had played once.
The opening round changed access to the knockout stage more than it changed the identity of the title favourites.
How the comparison works
This article is based on two paired simulation runs.
Reconstructed baseline
- 20,000 tournament simulations
- No official results locked
- Baseline ratings reconstructed by removing the visible live Team Strength deltas from the current production ratings
Current state
- 20,000 tournament simulations
- Updated production ratings
- The first 24 official group-stage results locked into the tournament state
Held constant in both scenarios
- Same simulation engine
- Same fixtures
- Same venues and venue context
- Same paired seed sequence
- Same tournament format and best-third selection logic
Using the same seed sequence reduces random simulation noise between the two runs. The comparison is designed to show movement between a reconstructed baseline and the current tournament state.
This is important: it is not a pure results-only experiment. The current-state run includes both locked official results and current rating updates. So the output measures total movement between two model states, not the isolated causal effect of one match in a vacuum.
The baseline should also be read as a reconstructed baseline, not as an exact archived pre-tournament snapshot.
All movements below are shown in percentage points, or pp.
Qualification paths moved fast
The largest movements appeared in Round of 32 qualification.
Biggest Round of 32 increases
| Team | Baseline | Current | Change |
|---|---|---|---|
| Australia | 38.75% | 89.73% | +50.98 pp |
| Sweden | 76.08% | 97.19% | +21.11 pp |
| Ghana | 57.52% | 77.16% | +19.64 pp |
| Cape Verde | 27.66% | 47.19% | +19.53 pp |
| Scotland | 62.26% | 81.70% | +19.44 pp |
Biggest Round of 32 decreases
| Team | Baseline | Current | Change |
|---|---|---|---|
| Turkey | 85.21% | 50.53% | -34.68 pp |
| Paraguay | 64.33% | 34.47% | -29.86 pp |
| Iran | 52.07% | 34.63% | -17.44 pp |
| South Africa | 32.44% | 15.10% | -17.33 pp |
| Tunisia | 23.62% | 6.82% | -16.80 pp |
Australia made the biggest upward move in Round of 32 probability, while Turkey took the biggest hit.
Group D is the clearest example of a path swing
Australia's +50.98 pp movement looks huge, but it makes more sense when read as a group-path swing rather than as a sudden jump in true team quality.
Before the opening matches, Group D was relatively tight. In the reconstructed baseline, Australia had only a 38.75% chance of reaching the Round of 32.
Then two results changed the structure of the group:
- Australia beat Turkey 2-0
- USA beat Paraguay 4-1
After those results, Australia's Round of 32 path rose to 89.73%.
At the same time, the other side of the group moved sharply the other way:
- Turkey fell from 85.21% to 50.53%
- Paraguay fell from 64.33% to 34.47%
The effect also carried into the Round of 16:
- Australia rose from 11.81% to 31.67%
- Turkey fell from 51.27% to 24.01%
- Paraguay fell from 27.87% to 12.05%
Australia's title chance, however, increased by only around 0.04 pp.
That is the key distinction. The model is not saying Australia suddenly became a major title favourite. It is saying Australia's route into the knockout stage improved dramatically.
A big qualification jump does not automatically mean a big title jump.
The title picture moved less
The title picture did move, but much less violently.
Biggest title-chance increases
| Team | Baseline | Current | Change |
|---|---|---|---|
| England | 9.10% | 11.12% | +2.02 pp |
| Argentina | 10.12% | 11.97% | +1.86 pp |
| Germany | 5.14% | 6.83% | +1.70 pp |
| France | 14.18% | 14.90% | +0.72 pp |
| USA | 1.23% | 1.82% | +0.60 pp |
Biggest title-chance decreases
| Team | Baseline | Current | Change |
|---|---|---|---|
| Spain | 15.73% | 12.01% | -3.72 pp |
| Portugal | 8.27% | 6.84% | -1.43 pp |
| Brazil | 8.37% | 6.94% | -1.43 pp |
| Turkey | 1.47% | 0.62% | -0.84 pp |
| Belgium | 3.43% | 2.97% | -0.46 pp |
England was the biggest title riser. Spain took the biggest title hit.
Spain is still one of the strongest teams in the simulation, but its opening 0-0 draw against Cape Verde damaged the shape of its tournament path. Its chance of reaching the Final fell from 24.68% to 19.36%, while its champion probability fell from 15.73% to 12.01%.
So the title picture did change. It just changed more slowly and more narrowly than the qualification picture.
The best-third table is a tournament inside the tournament
The new 48-team format introduces a second qualification contest inside the group stage.
Each of the twelve groups produces a third-place team. Eight of those twelve teams advance.
That means third-place qualification depends on two separate things:
- Which team finishes third in its own group
- Whether that team ranks inside the best eight third-place finishers across all twelve groups
That second question creates a cross-group cutoff race.
A result in one group can affect the qualification environment for the third-place finisher in another. That is why the best-third table can move in ways that are harder to see by looking only at a single group table.
How to read the group metric
When we say:
Group H third-place qualification: 63.21%
that does not mean one specific team has a 63.21% chance.
It means that in the current-state simulations, whoever finishes third in Group H qualifies as one of the best eight third-place teams 63.21% of the time.
All 12 groups: how the best-third path moved
The table below shows how often each group's eventual third-place team advanced as one of the best eight third-place teams.
This is not the probability for one fixed team. Each simulation produces a third-place team in every group, then the model checks whether that team clears the cross-group cutoff.
Sort by group, baseline, current probability, or change.
| Group F | 73.03% | 82.21% | +9.18 pp |
| Group C | 65.73% | 74.47% | +8.74 pp |
| Group D | 71.39% | 73.26% | +1.87 pp |
| Group A | 73.93% | 72.76% | -1.17 pp |
| Group E | 73.21% | 72.09% | -1.11 pp |
| Group K | 62.89% | 69.26% | +6.37 pp |
| Group I | 69.99% | 65.28% | -4.70 pp |
| Group B | 70.67% | 65.14% | -5.53 pp |
| Group H | 49.48% | 63.21% | +13.73 pp |
| Group L | 62.90% | 62.54% | -0.35 pp |
| Group J | 64.89% | 55.82% | -9.06 pp |
| Group G | 61.93% | 43.99% | -17.94 pp |


The table defaults to current best-third qualification rate, and the headers can be used to compare the groups from other angles.
Group H had the biggest positive movement, rising from a near coin-flip best-third environment to a much safer one. Group G moved the other way, falling below 44% and becoming the harshest third-place environment in this comparison.
The smaller movements matter too. Groups L, E, and A barely moved compared with the larger swings at both ends. That shows the best-third race did not move evenly across the tournament. The opening round created a few clear pressure points rather than shifting every group by the same amount.
In short:
- Friendliest movement: Group H, Group F, Group C
- Harshest movement: Group G, Group J, Group B
- Almost flat: Group L, Group E, Group A
This is where the format gets interesting. The opening round did not just move teams inside their own groups. It also moved the shared third-place cutoff across the entire tournament.
The best-third table is effectively a tournament inside the tournament.
Ecuador is the clearest example of the format's complexity
Ecuador produced the most unusual third-place movement in the comparison.
Its total probability of finishing third jumped from 33.64% to 70.94%, a rise of 37.31 pp.
That was:
- the highest current total third-place probability in the model
- the largest increase in total third-place probability
- the largest increase in third-and-qualified probability
- the largest increase in third-and-eliminated risk
The closest team in current total third-place probability was Senegal at 66.19%, while Czechia had the second-largest increase at +22.82 pp.
Ecuador's third-place decomposition
| Outcome | Baseline | Current | Change |
|---|---|---|---|
| Finishes third and qualifies | 25.68% | 50.71% | +25.04 pp |
| Finishes third and is eliminated | 7.96% | 20.24% | +12.28 pp |
| Total probability of finishing third | 33.64% | 70.94% | +37.31 pp |
The first Group E results explain why:
- Germany beat Curaçao 7-1
- Ivory Coast beat Ecuador 1-0
Germany's result made the top of the group harder to reach. Ecuador's defeat pushed it away from the direct top-two route and toward the third-place corridor.
Ecuador's overall Round of 32 probability actually fell from 83.73% to 70.15%. So this is not a simple good-news story.
If we subtract Ecuador's third-and-qualified probability from its overall Round of 32 probability, that suggests its direct top-two route fell from roughly 58% to roughly 19%.
So the real Ecuador story is not that it became plainly stronger or weaker.
Before:
Direct top-two qualification was the main path.
After:
Third place became the dominant path.
Ecuador is now much more likely to live inside the third-place corridor, where there is both more opportunity and more cutoff risk.
Its third-and-qualified probability rose by 25.04 pp, but its third-and-out risk also rose by 12.28 pp.
That is why Ecuador is the clearest "this format is weird" example in the first-round comparison.
Finishing third is not the same as qualifying from third
This distinction matters.
Ecuador's 70.94% figure means it finished third in 70.94% of current-state simulations.
It does not mean Ecuador had a 70.94% chance of advancing if it finished third.
A rough conditional qualification rate can be estimated by dividing:
third and qualified / total probability of finishing third
For Ecuador:
- Baseline: roughly 25.68 / 33.64, or about 76%
- Current: roughly 50.71 / 70.94, or about 71%
So Ecuador became much more likely to finish third, but the third-place route itself did not become safer on a conditional basis.
It simply became far more central to Ecuador's qualification outlook.
This is a big part of what makes the best-third system harder to read than a standard top-two group format.
What the first round really changed
The first 24 matches did not completely rewrite the hierarchy of the strongest teams.
They changed something more immediate:
- which teams control their direct qualification route
- which teams are drifting toward third place
- which groups offer a friendlier best-third environment
- which teams now face a more difficult path through the bracket
Australia is the clearest example of a team gaining control of its route.
Turkey and Paraguay are the clearest examples of losing it.
Spain shows how an opening result can damage a top team's path without removing it from the top tier of the model.
Ecuador shows how the 48-team format can push a team away from direct qualification and into a high-frequency third-place scenario.
How to read the numbers
These outputs are simulation references, not guarantees.
A few caveats matter.
The baseline is reconstructed
The baseline was created by removing visible live Team Strength changes from the current production ratings. It is not an exact archived copy of an earlier published forecast.
Results and rating updates move together
The current-state comparison includes both:
- locked official results
- updated production ratings
So this measures movement between two model states. It does not isolate the exact causal contribution of one match result or one rating change.
Tiny late-stage changes can be noisy
At 20,000 simulations, movements below roughly 0.20 to 0.30 pp should be treated cautiously, especially in Final and Champion probability for teams already near zero. The strongest signal here is in the larger qualification and third-place shifts.
Main takeaway
The first round did not overturn the entire title race.
It rewired the routes into the knockout stage.
Qualification paths moved faster than title chances, and the new best-third system amplified the effect. A single early result can now change not only one team's position inside its group, but also the cross-group cutoff faced by third-place teams across the tournament.
That is the big story after every group played once.
The hidden tournament moved more than the trophy race.